In today's fast-paced world, where data is king, the ability to harness and utilize massive volumes of information has become a critical component for businesses looking to stay ahead of the competition. According to a report by IDC, the global datasphere is expected to reach 175 zettabytes by 2025, with much of this data being generated by businesses. With such massive volumes of information, designing data-intensive applications that can efficiently process, store, and analyze this data has become a critical challenge for organizations.
The challenges of designing data-heavy applications are not just technical but also involve ensuring the apps meet the business requirements and provide value to the end users. And that’s what we at Eleken UI/UX design agency help companies address. We’ve collaborated with numerous startups and established businesses, designing data-intensive applications and working closely with clients' product teams to develop intuitive and seamless experiences through multiple iterations.
In this article, we want to share this experience and tell you about main challenges you might face when designing data-intensive applications, share some of our real cases where we have helped solving them, and provide some best practices to follow when designing data-intensive apps.
But before we dive into the main part, let's first define what we mean by a data-intensive application.
What is a data-intensive application?
A data-intensive application is an application that processes and analyzes large amounts of data, typically in real-time or near real-time. These applications are designed to quickly and efficiently process, store, and manage vast amounts of constantly changing data to provide insights, make data-driven decisions, and support complex business operations.
Industries that demand this type of software usually have a large number of users, high data volume, and frequent interactions. Here are some of them:
- Banking and financial services process and analyze loads of data to detect fraud, manage risk, and make data-driven investment decisions. Data-heavy apps help these institutions manage and analyze information from various sources, including customer data, transaction data, market data, and regulatory data.
- Data science and data mining industry need data-intensive applications to improve data management, develop more accurate predictive models, enhance machine learning, create better visualizations, and enable real-time analytics.
- Digital marketing industry uses data-intensive applications to analyze consumer behavior, geographic region, target ads, and measure the effectiveness of marketing campaigns. These applications process data from various sources, such as social media, website traffic, and customer data, to provide insights that can help marketers optimize their strategies.
- E-commerce companies generate data from online sales, customer behavior, and website traffic. Data-intensive applications help them manage and analyze this data to personalize the customer experience, optimize pricing and inventory, and improve supply chain management.
Before diving into challenges, it’s useful to look at how real products solve them in practice.
Design inspiration: data-heavy applications
Well-designed data-intensive applications share one thing in common: they translate complex systems into clear, actionable experiences. Below are several examples, from Eleken projects to industry-leading platforms, that demonstrate how thoughtful design can make even the most complex data understandable and usable.
Glow Labs: Making analytics accessible for non-experts
One of the most common problems in data-heavy products is that users are not analysts, yet they still need insights.
In our work on Glow Labs, a Web3 analytics platform, users needed to quickly understand community engagement without digging through raw data.
To solve this, we designed a KPI-first dashboard:
- Key metrics are placed front and center.
- Supporting graphs provide context without overload.
- Simple red/green indicators highlight performance at a glance.
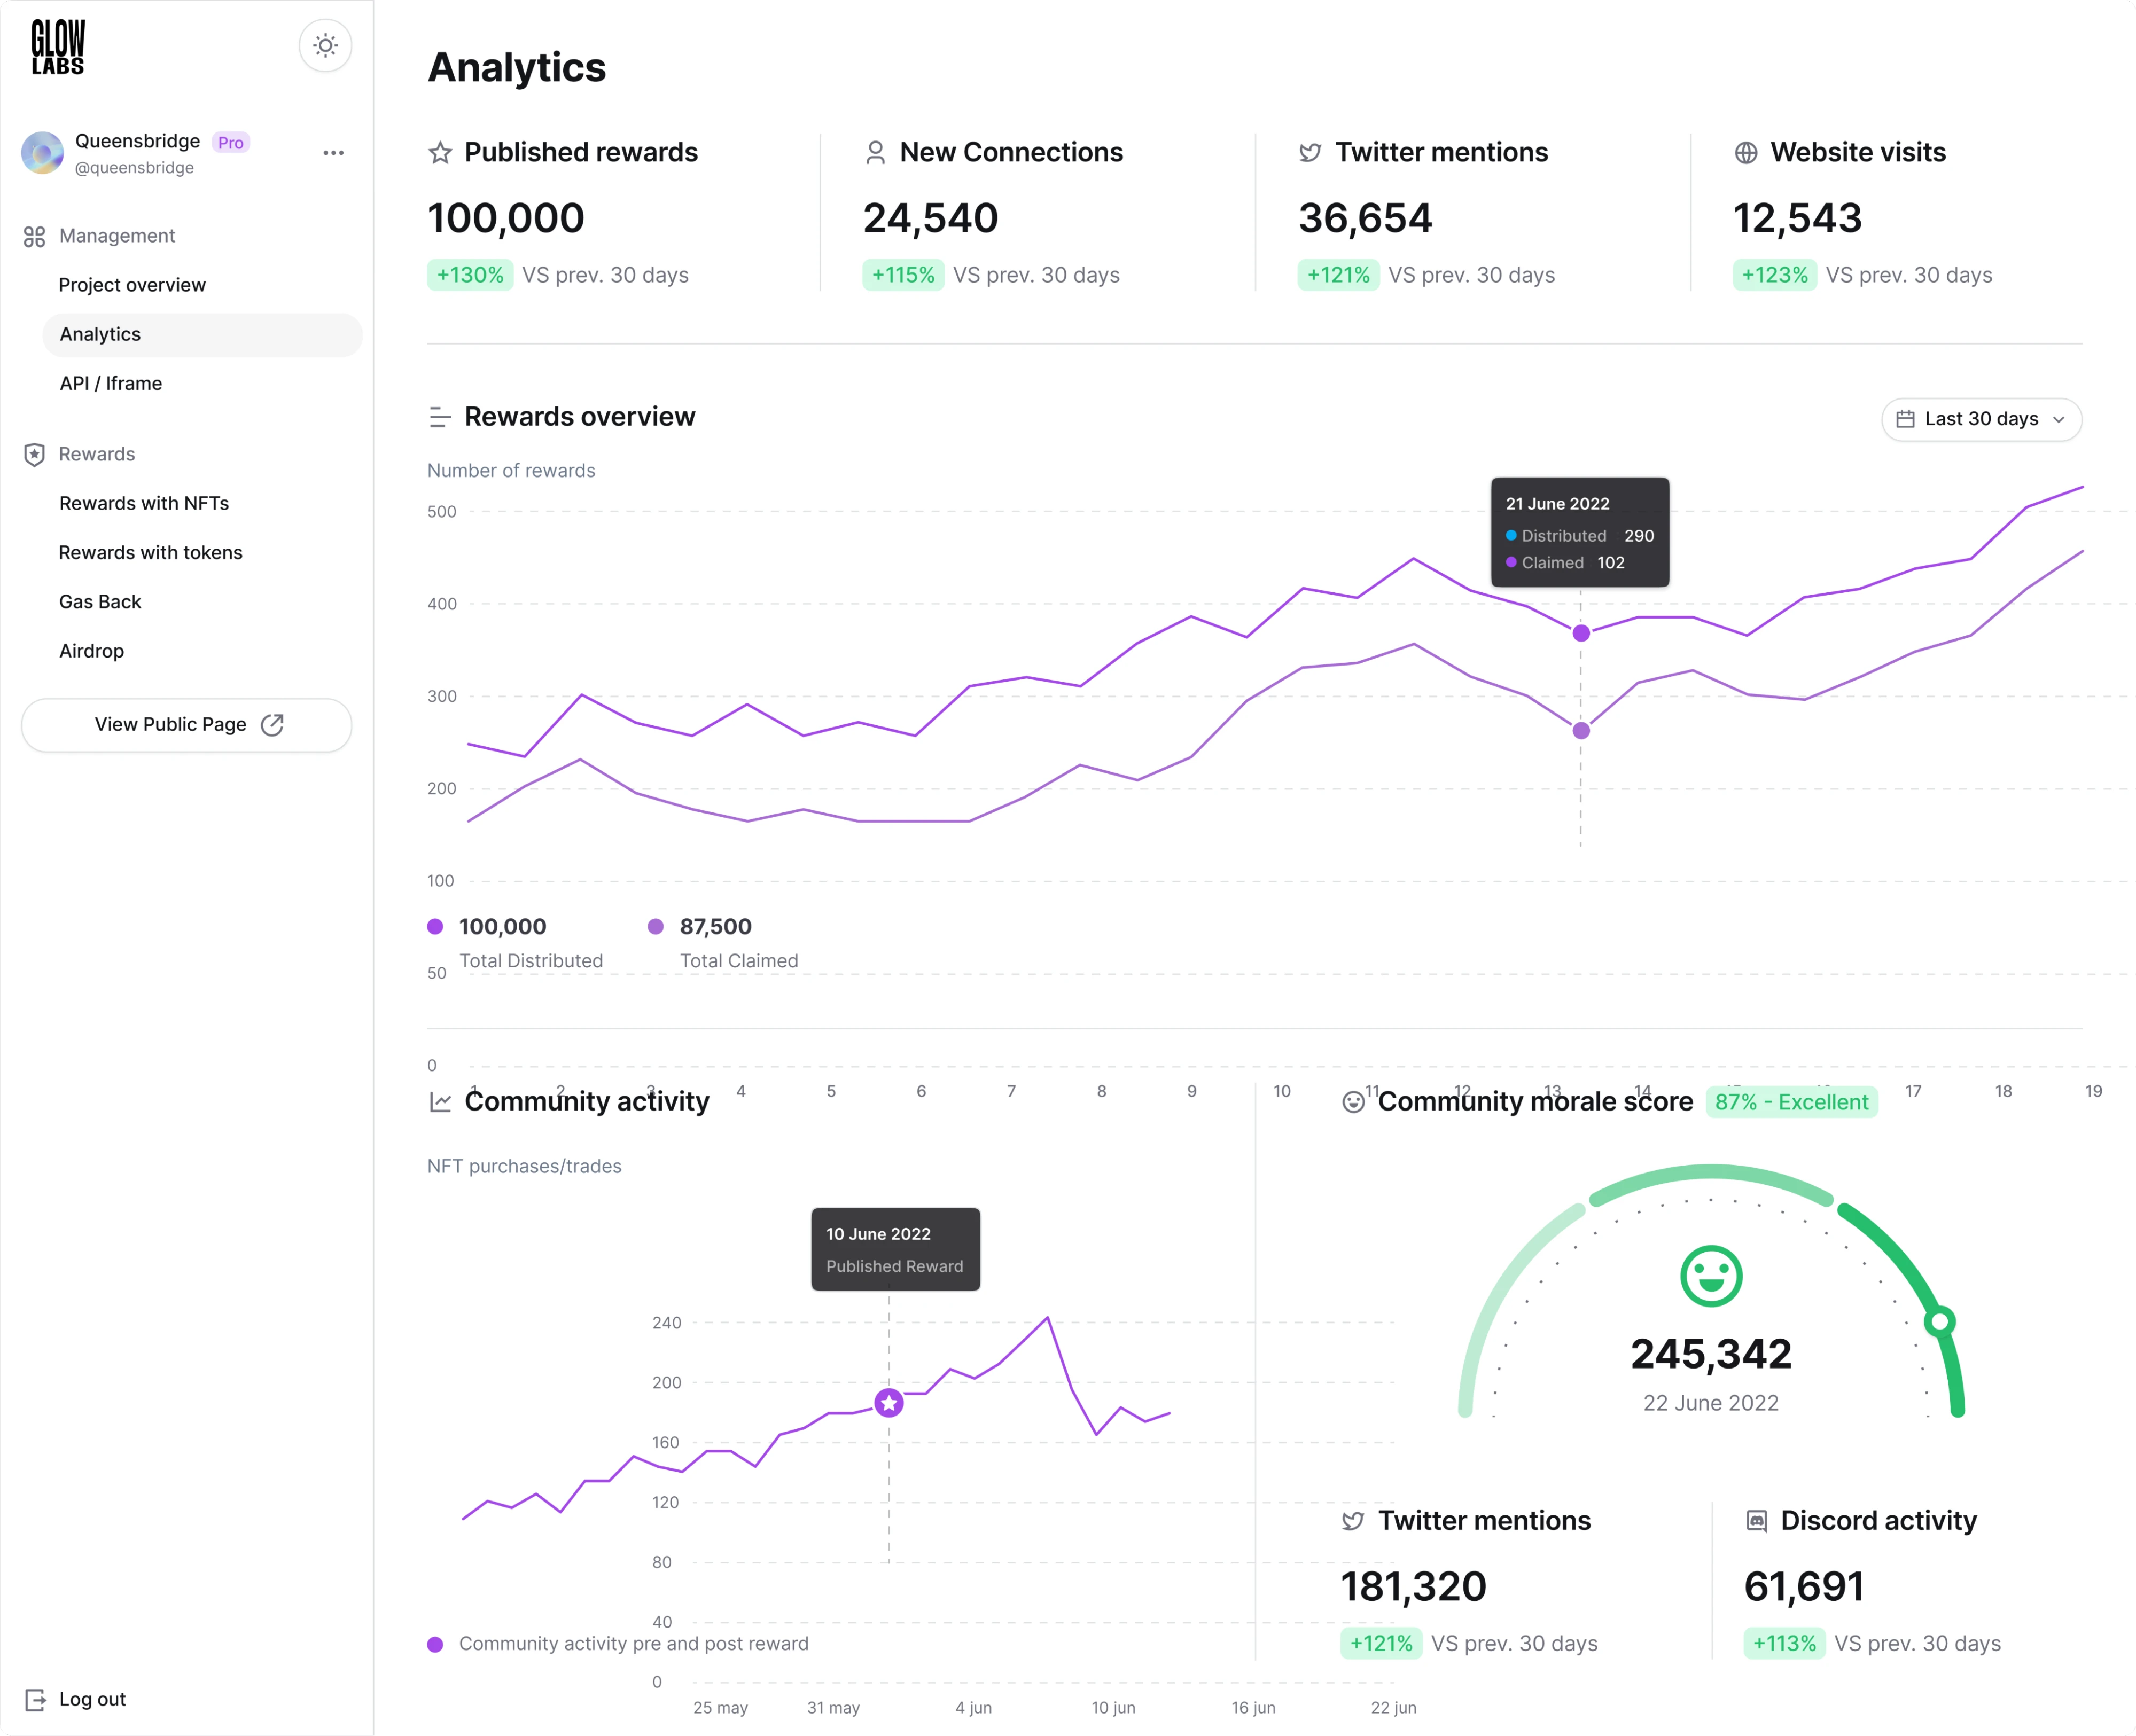
Key takeaway: When your audience isn’t technical, prioritize clarity over completeness. For better user engagement, start with answers, then allow users to explore deeper.
Vector0: Helping users prioritize critical data
In systems where data volume is overwhelming, the main challenge is prioritization.
For Vector0 (DarkWave), a cybersecurity platform, users had to monitor massive volumes of vulnerability data and quickly detect threats.
We introduced:
- Severity-based visualization (critical → low).
- Expandable panels for deeper inspection.
- Data merging from multiple sources.
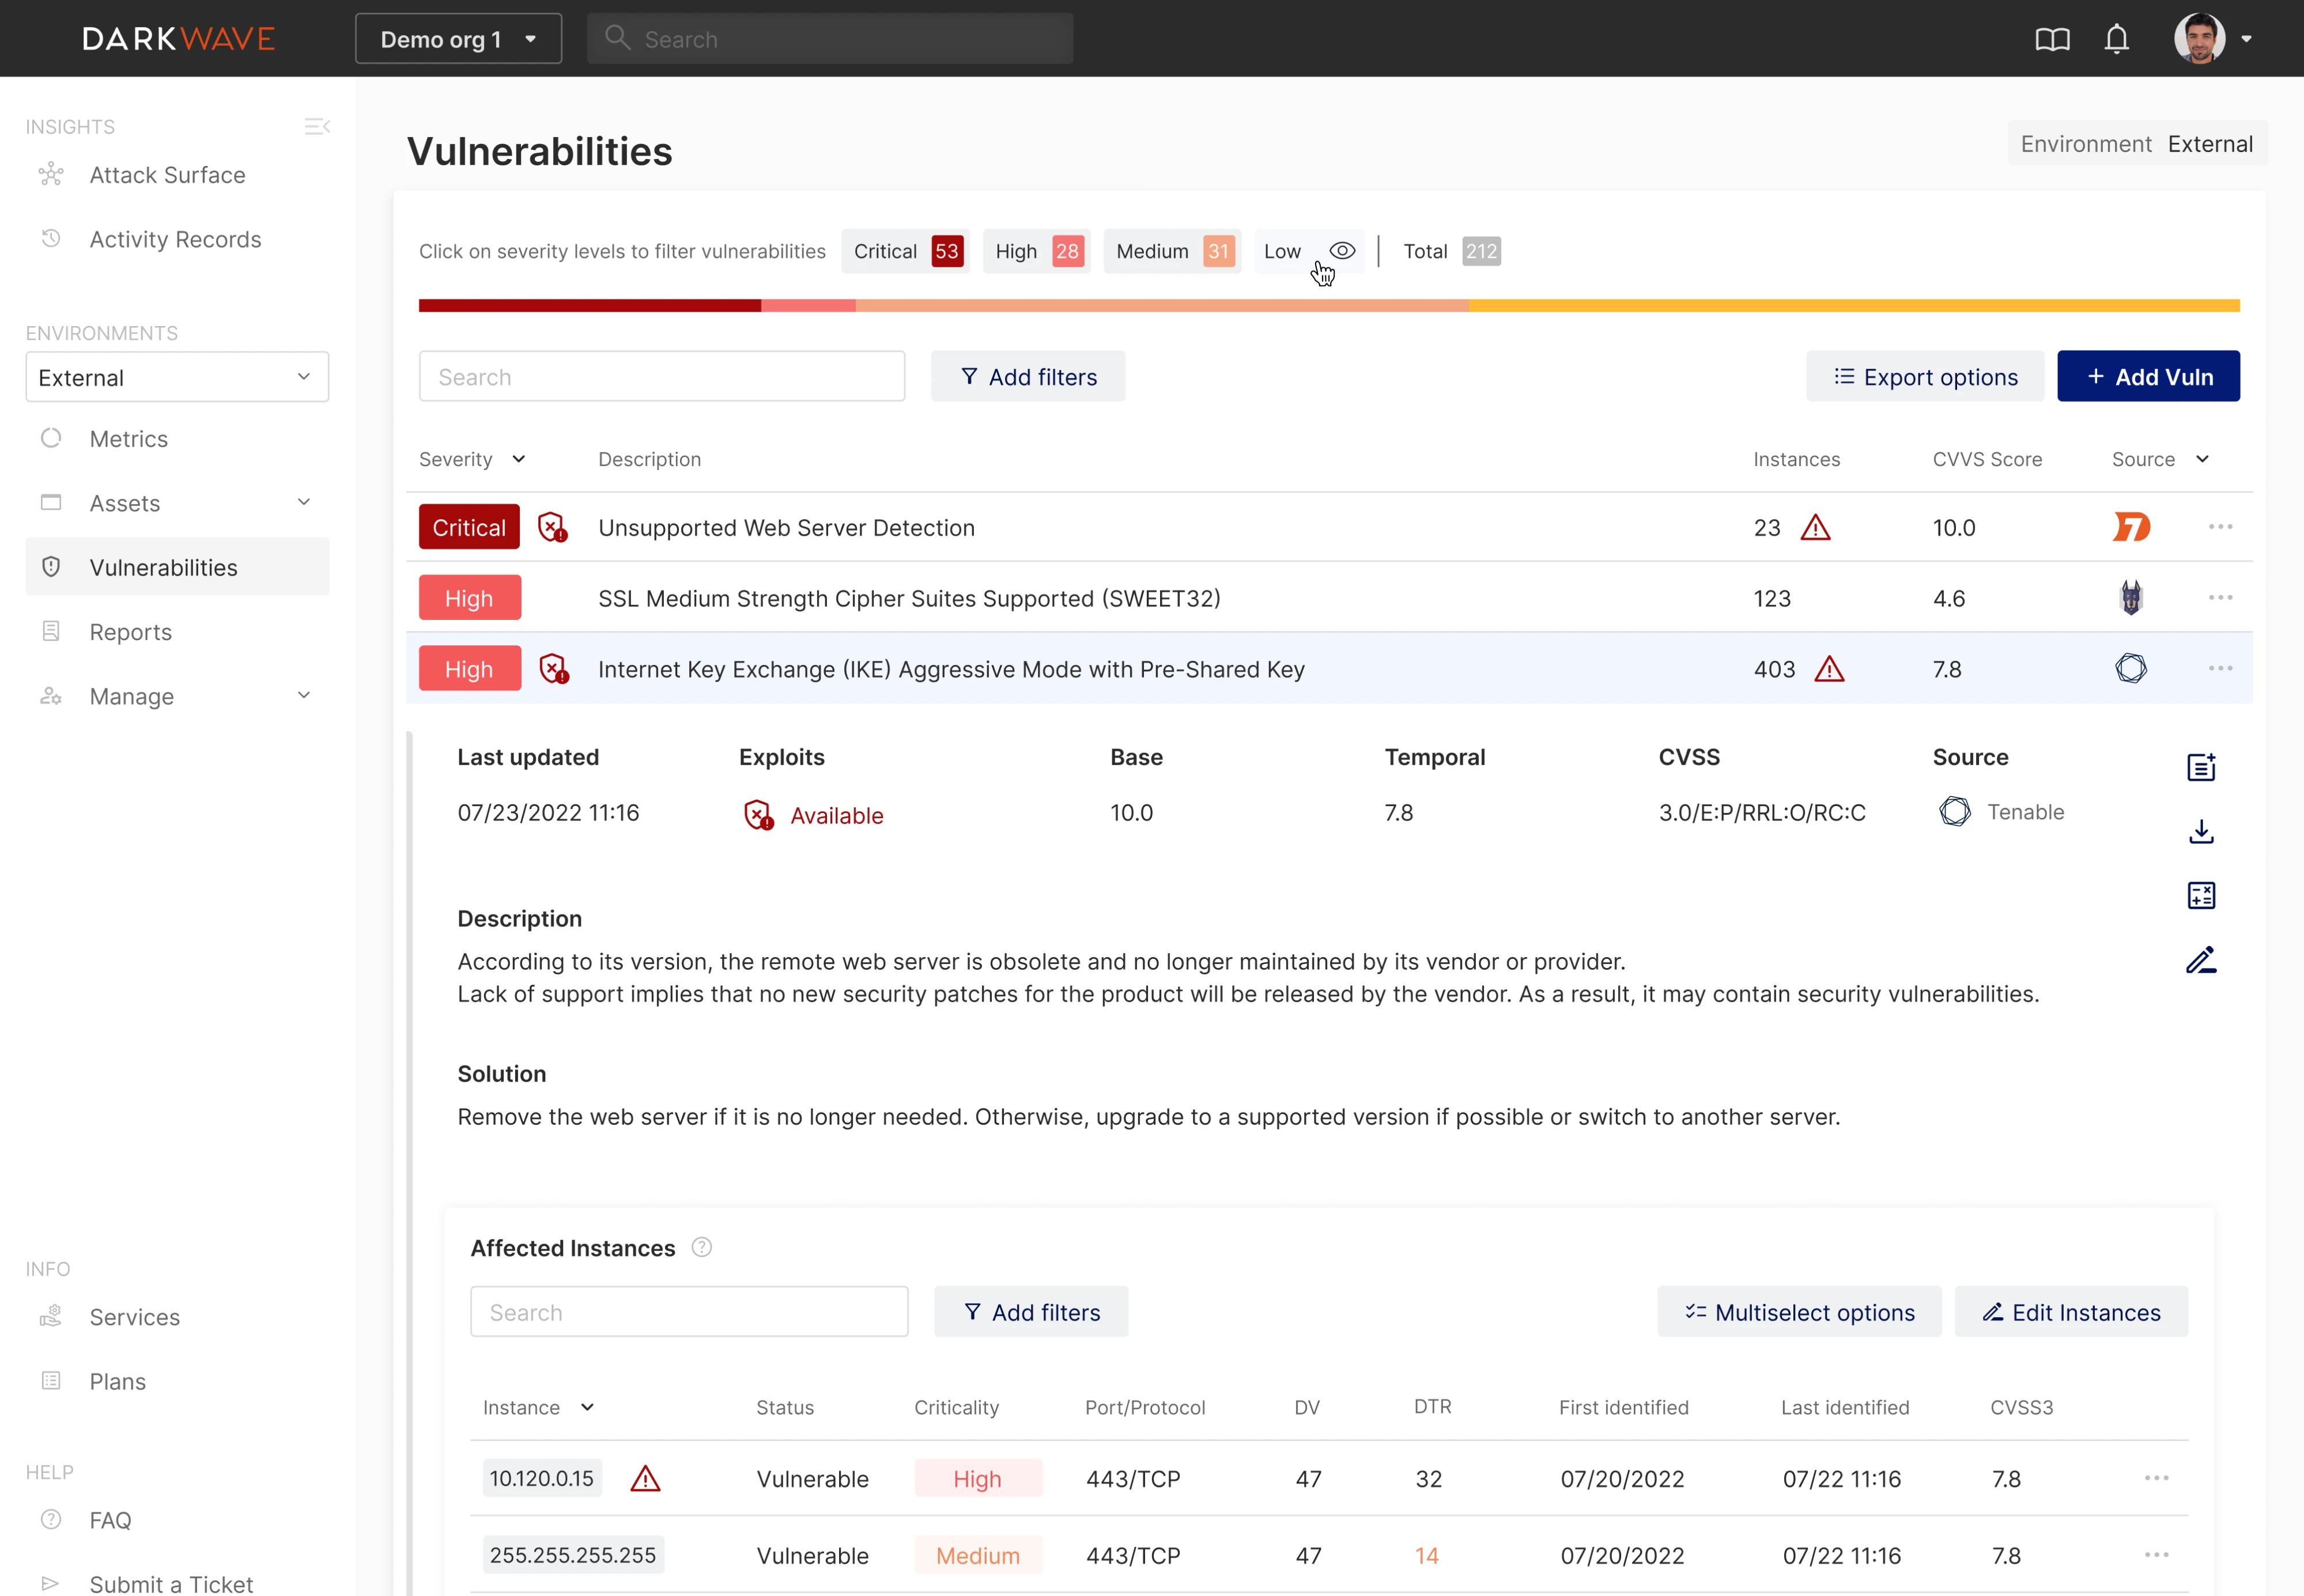
Key takeaway: Design should answer the question: “What matters right now?” Not all data deserves equal attention; hierarchy is everything.
Data Streams: Designing for complex data, workflows, and datasets
In products where users actively work with data (not just view it), flexibility becomes essential.
In Data Streams, a data management SaaS, users struggled with overloaded data tables and rigid layouts.
We addressed this with:
- A drag-and-drop dashboard builder.
- Improved information architecture.
- A multi-panel layout for navigation, filters, and data.
Key takeaway: When workflows are complex, let users create interface around their tasks, not the other way around.
Stripe :Translating system complexity into human understanding
Some of the best inspiration comes from infrastructure-level products that deal with extreme data complexity.
Stripe, for example, handles high-throughput financial data and complex event flows, yet its interface feels intuitive.
Instead of exposing raw logs, Stripe uses:
- Timeline-based views for payments.
- Clear event histories (charges, refunds, disputes).
- Developer-friendly observability tools and design system.
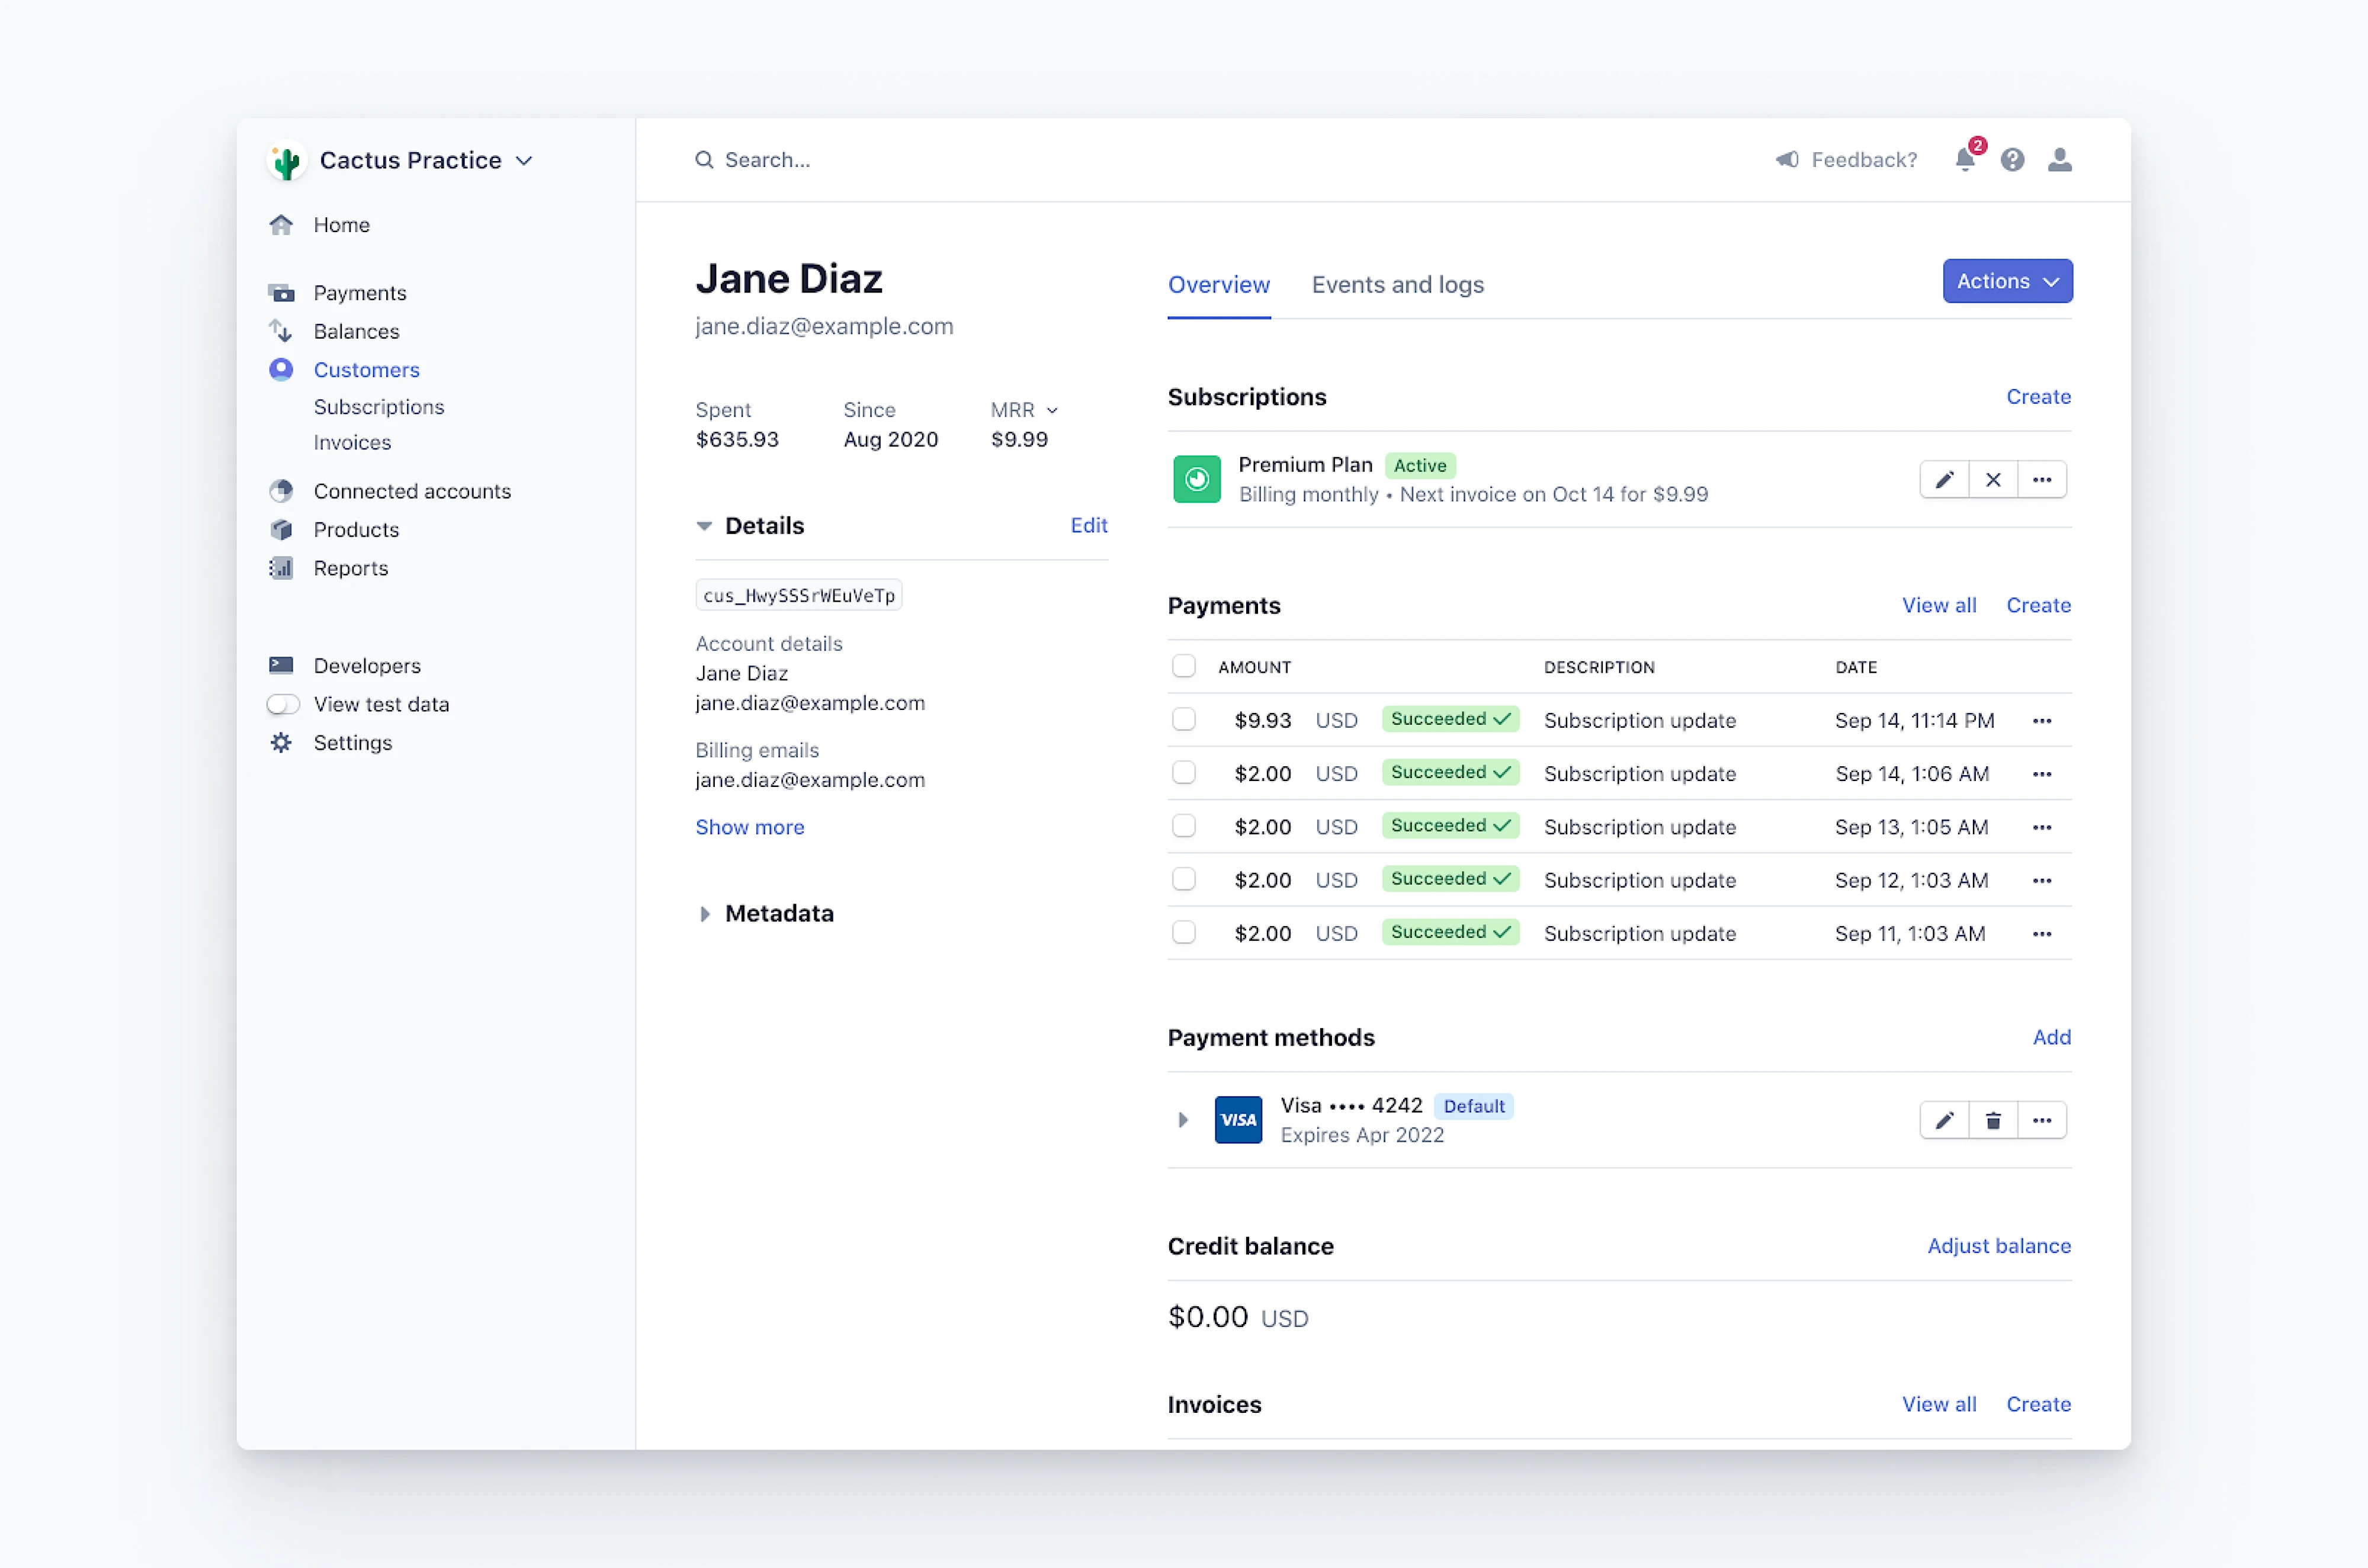
UX insight: Stripe turns distributed system behavior into a story users can follow.
Datadog: Supporting exploration in large datasets
When users don’t know what they’re looking for, the interface must support discovery.
Datadog, an observability platform, solves this by combining:
- Logs, metrics, and traces in one view.
- Faceted search and filtering.
- Drill-down dashboards with linked views.

UX insight: Great data tools should not only display relevant information but also help users ask better questions.
Snowflake: Hiding complexity behind simple interactions
In contrast, platforms like Snowflake take a different approach. They minimize UI complexity by exposing only what matters.
Key optimistic UI principles include:
- A query-first interface (SQL as the main interaction).
- Clear separation of data structures (database / schema / table).
- Abstracted infrastructure (no need to think about scaling).
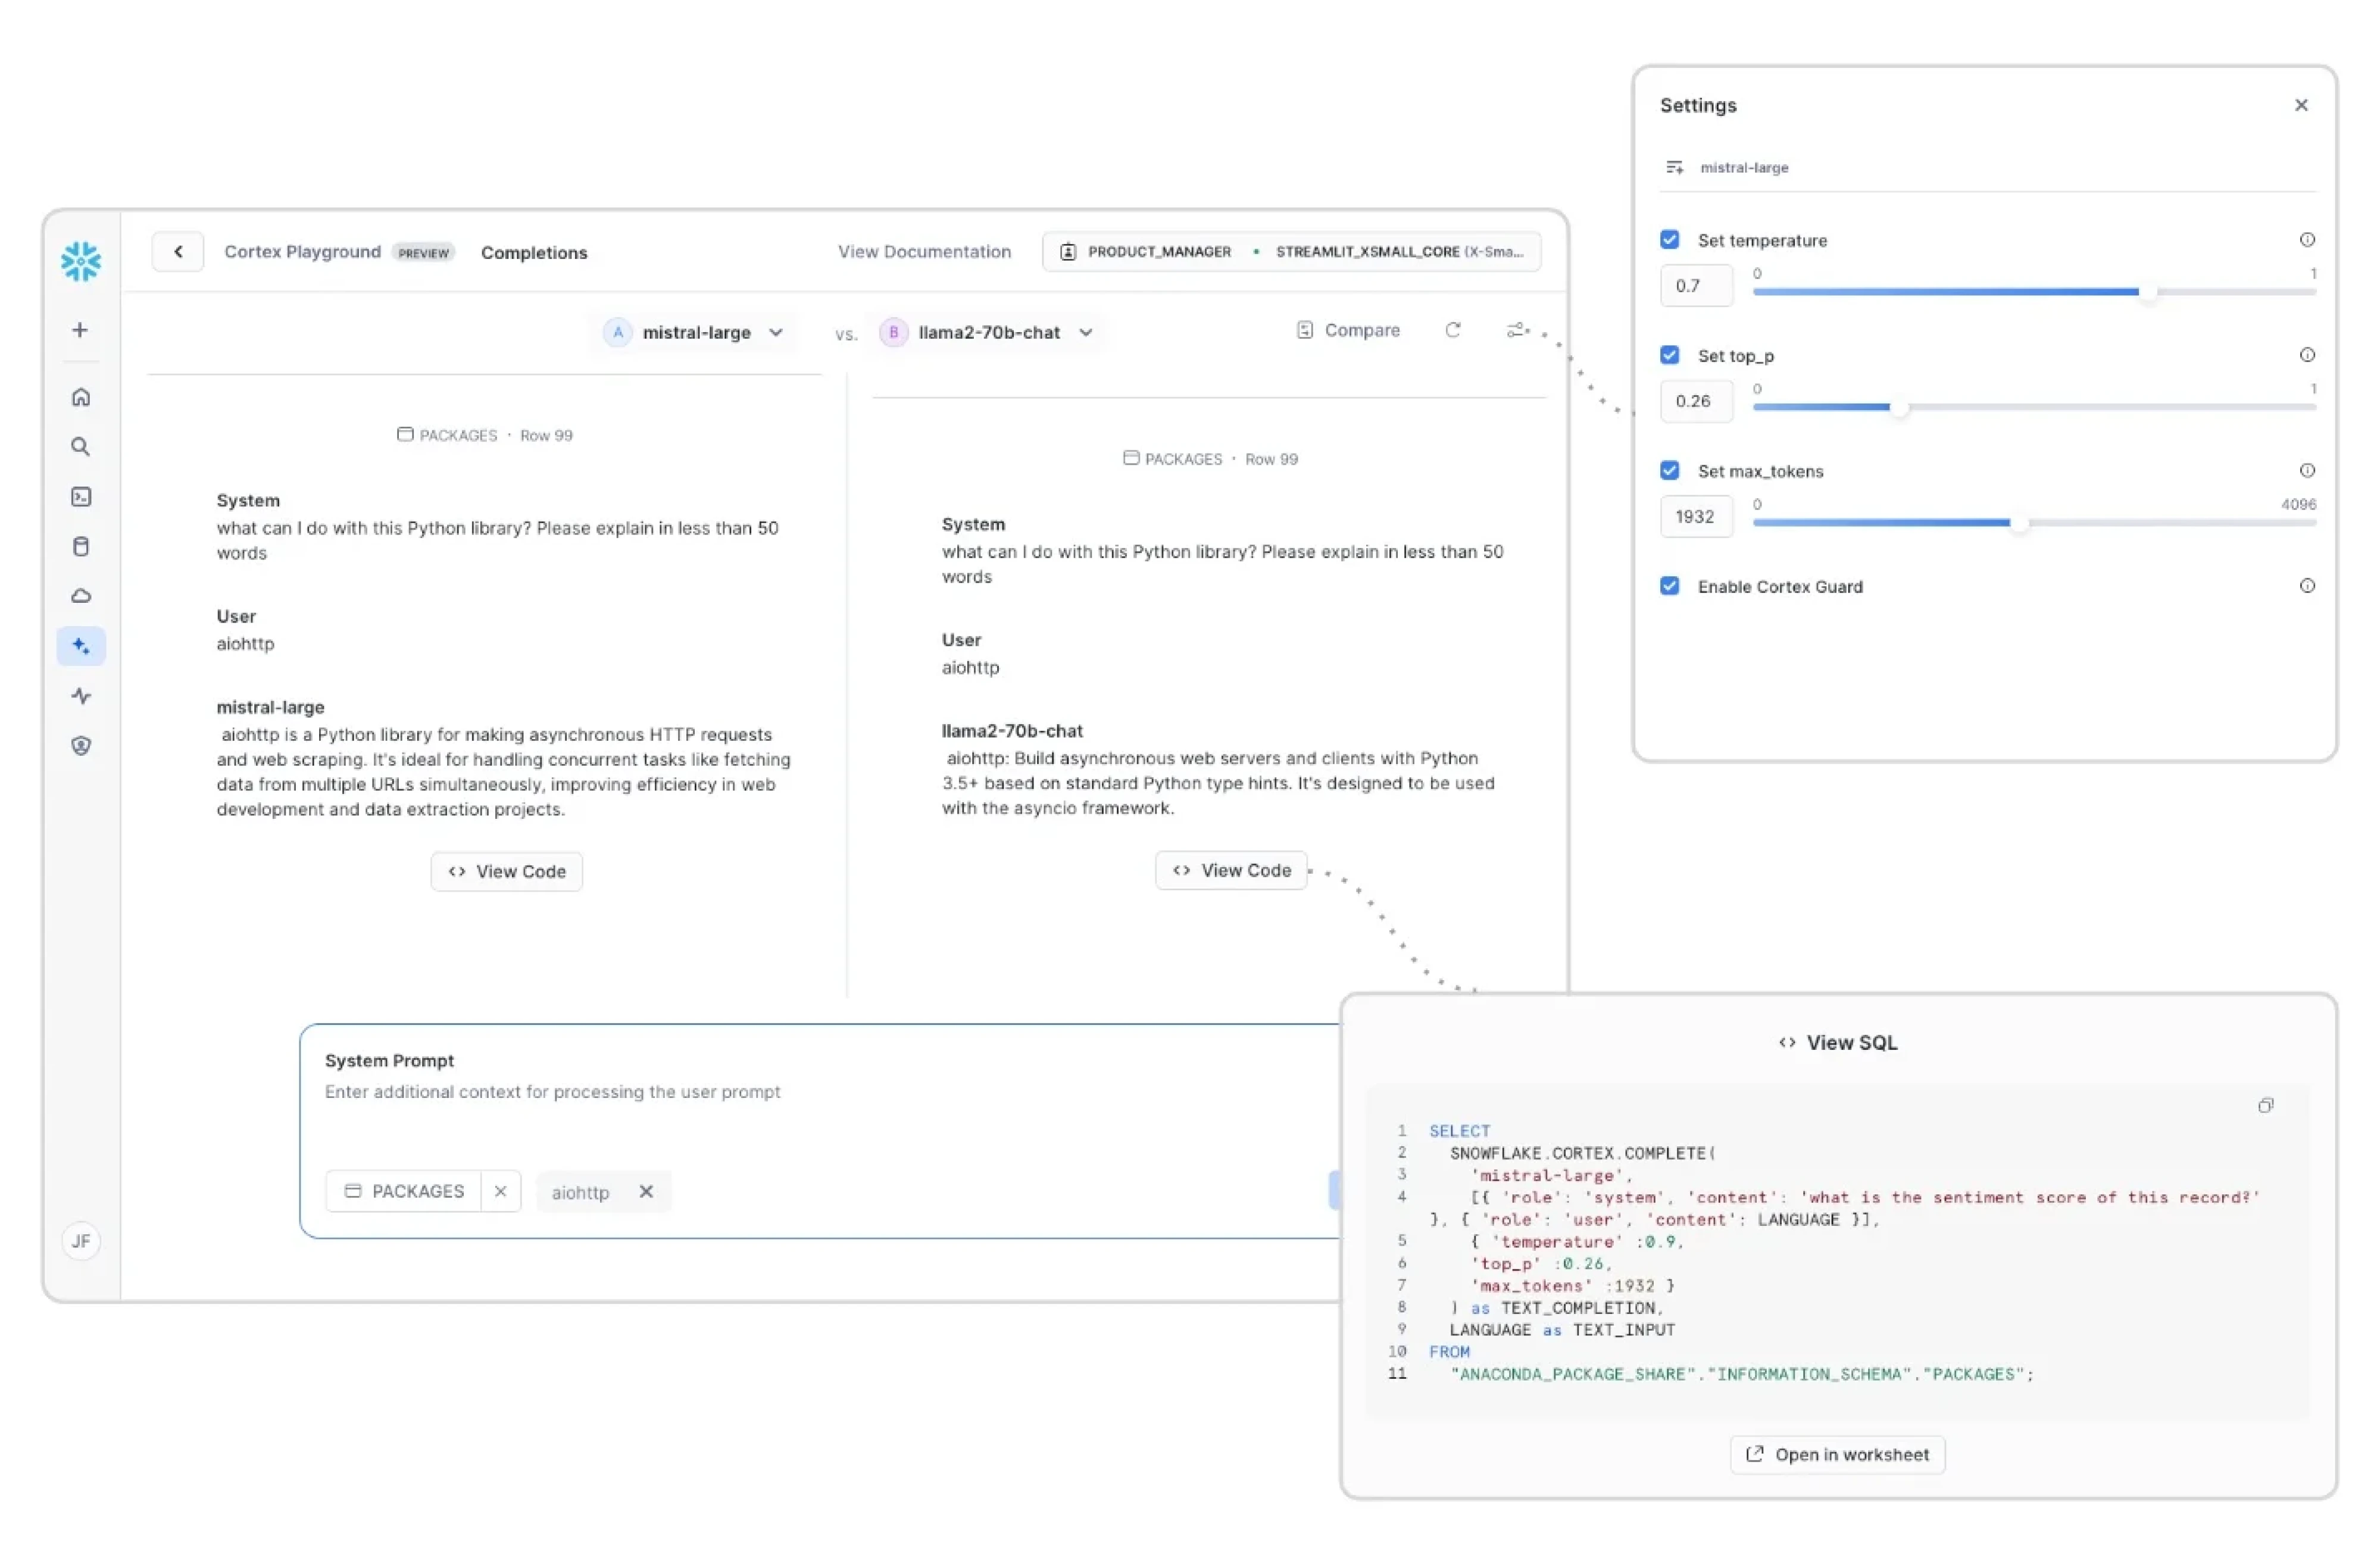
UX insight: Sometimes the best design decision is what you choose not to show.
Airbnb: Democratizing data across organizations
Finally, platforms like Airbnb’s data ecosystem show how design can make data accessible beyond technical teams.
Their approach includes:
- A semantic layer with standardized metrics.
- Self-serve analytics for non-engineers.
- Clear data lineage and trust indicators.
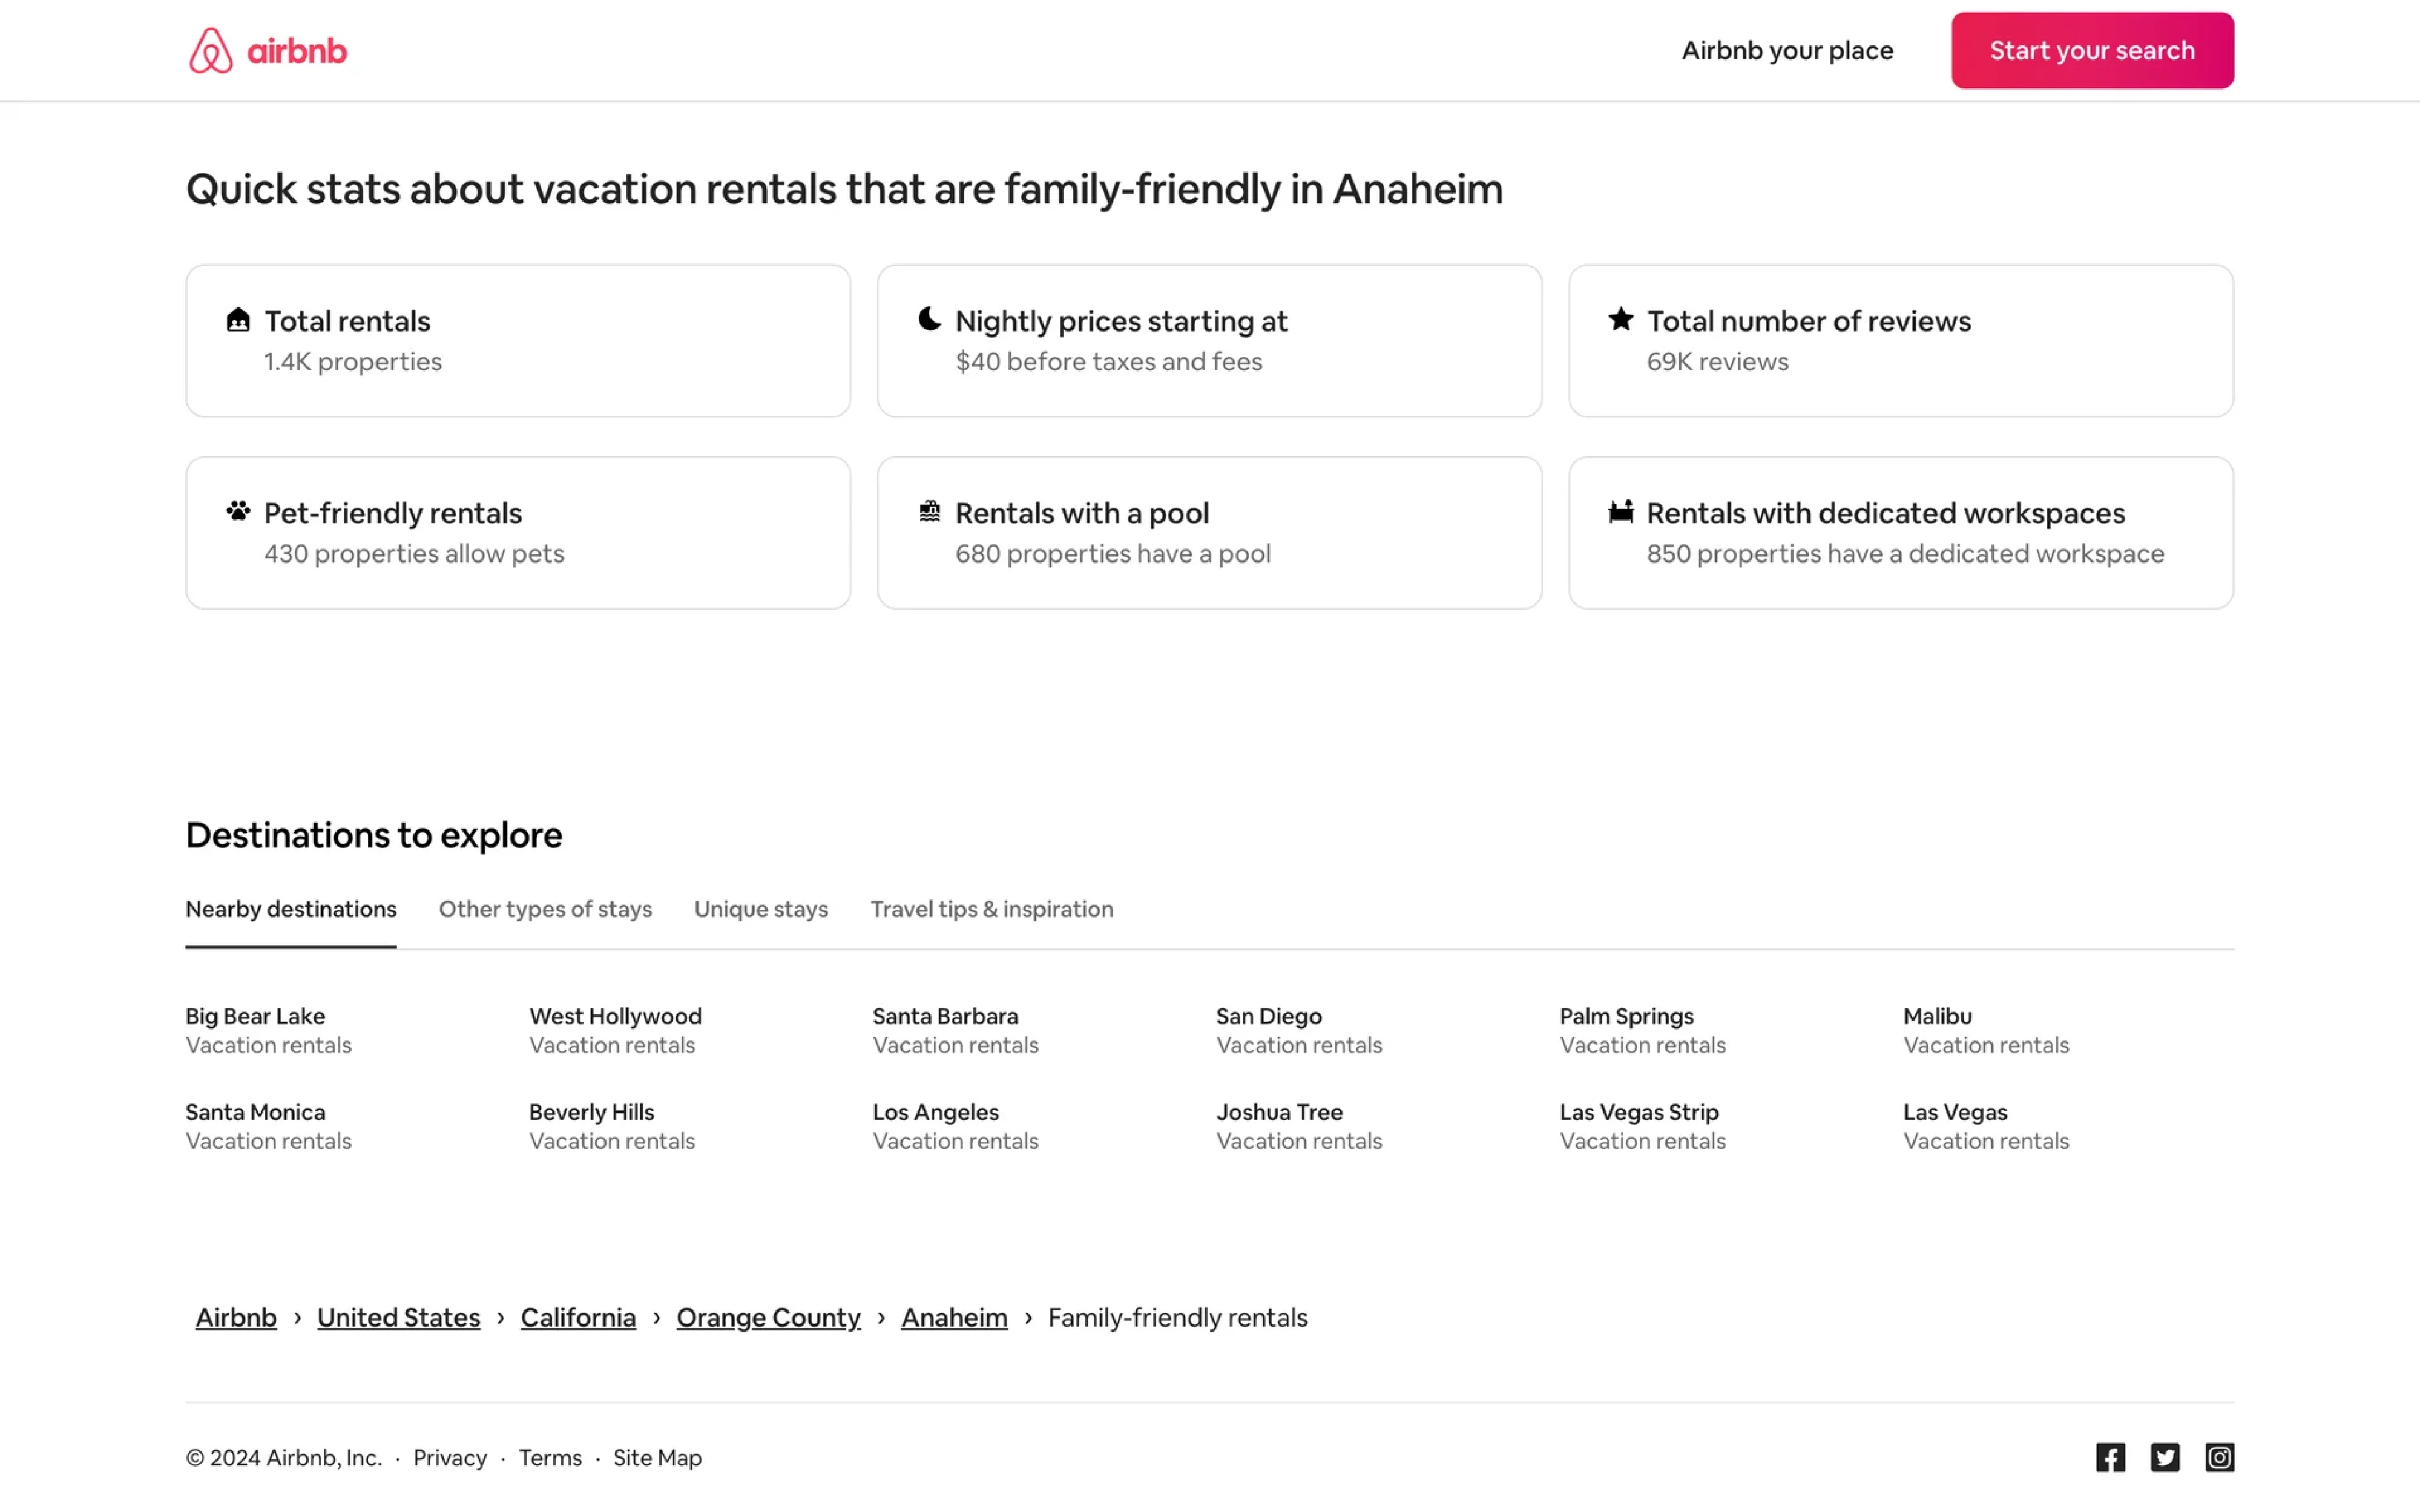
UX insight: Data becomes truly valuable only when everyone in the organization can use it confidently.
These patterns directly address the unique challenges we’ll explore next, from real-time data handling to scalability and data representation.
To bring real benefit to the business, and help stakeholders make faster and more-informed decisions, the data-intensive app must be able to gather, process, and present data in an easy-to-comprehend format. Mastering data product UX ensures that even the most complex datasets remain accessible and actionable for the end-user. This fact causes various challenges in data-intensive application design, particularly when dealing with geospatial UX where location-based data adds another layer of complexity to the interface. Let’s talk about them.
Data heavy UX design challenges
Each time we design big data applications, we face various difficulties: some of them are completely unique for each specific case, and some have common patterns that repeat from project to project. Here, we’re going to discuss typical challenges that we usually encounter.
Challenge 1. Constantly changing data that often needs to be processed in real-time
Managing the overwhelming amount of information is difficult and exhaustive for users. Too many graphical elements can distract and confuse them. That’s why designing for real-time data processing requires careful consideration of the user interface (UI) design.
Data-heavy UI design should display real-time data in a clear and concise manner so that users can quickly and easily understand what is being shown. The app should also provide users with the ability to customize the way in which the data is presented, such as through the use of filters, proper dashboard design, and visualizations.
One of our projects that illustrates this problem well is Astraea, a geospatial artificial intelligence (AI) platform that processes and analyzes earth observation data, and its product, Earth OnDemand, in particular.
Earth OnDemand offers detailed information about the chosen area by integrating data from various satellite imagery sources. And here’s the thing: as the app uses many different data sources, users can access numerous versions of images from one location. So searching, processing, and managing all these data requires a lot of user interaction.
To prevent customers from struggling to process the abundance of information, our task was to redesign Earth OnDemand, making it simpler for people to engage with constantly changing data.
Here’s what we’ve done to solve this problem:
- Created categories for the navigation menu to declutter the interface and help users manage the abundance of information available to them. Each category is hidden behind an icon located on the left side of the screen. By clicking on an icon, users can open or close another menu that includes options like Filters, Favorites, Downloads, and more.
%2520(1).png)
- Highlighted key elements of the interface with a dark color to create a visual hierarchy, this way directing user’s attention to areas that matter the most.
- Added filters to help users sort the information quickly and simplify the search process.
- Created an option to hide the side menu so that the user could focus on their main task.
.png)
Challenge 2. Designing for multiple user types
Data-intensive applications may have multiple user types, each with different needs and levels of expertise. It's important to design the application in a way that caters to different user types, with clear demarcation between audiences and the ability to provide a high-level summary or deep-dive analysis of the data points.
And we just can’t help mentioning our project Involi here - a UI/UX redesign for a cloud-based platform that provides visualization tools for air traffic detection and visualization, drone remote identification, and live drone tracking. The goal of the redesign was to make a product more attractive to new users, while retaining the loyalty of existing ones.
%2520(2).png)
The problem that we faced was that the software had four main user groups, each working with data in a different way and requiring different features and different levels of access to key data. So we had to think out interface designs for each user category, taking into account their needs.
How did we cope with this task successfully? Only thanks to thorough user research and persona mapping.
To create a design that meets the expectations of each user type, we had to analyze the existing product and its users, along with their problems, needs, and business goals.
- First, we held interviews with Involi's CTO to learn the product's purpose, features, design and legal restrictions, stakeholders' expectations, and of course, its customers.
- Next, we conducted our own analysis of the software to learn how customers use it, identify what works well and what doesn't, and propose possible ways for continuous improvement.
- Based on the information we gathered, we managed to create user personas and user roles that showed access to what data each user type needed, what features they used, and what problems with key data points they faced. This approach is at the core of human-centered design for data products, ensuring the interface serves the human behind the screen.
Thanks to the deep initial research, we managed to come up with numerous effective improvements and innovations and reached the goals of the redesign. See it yourself in the Involi case study.
Challenge 3. Scalability and maintenance
It’s typical for data-intensive applications to experience growth in data volume, complexity, and traffic. This requires a robust architecture and user-friendly design that can be maintained and updated as the application transforms.
Additionally, as data-heavy apps are constantly evolving, new features and functionalities are added to them over time. It is important to ensure that these new features are aligned with the existing design and interaction so that the end-users have a seamless experience.
It wouldn’t be an exaggeration to say that we care about scalability in each of our projects. But, of course, it’s especially true for data-heavy design. Let’s take Gamaya as a great example.
Gamaya is a SaaS platform that processes and analyzes agricultural data to help farmers optimize agricultural operations. They came to Eleken with a big vision, they wanted to grow, gain new customers and expand to new markets. But for that purpose, they needed to fix the UI/UX of their existing MVP first and prepare the product for scaling.
.png)
Gamaya's app uses React, a frontend tool for building web user interfaces, with a component-based architecture that allows developers to create reusable components and assemble them in various combinations. And here’s how we took advantage of this technology to make the app easily scalable:
- We used Ant Design, a ready-made React UI library, and adapted our design to this library.
- We prepared a UI kit and a guide to help developers implement necessary design components using Ant Design.
- We also ran a demo session to explain how to implement complex components.
This approach let the Gamaya team reuse materials from the library and design system, delivering new products quickly and efficiently. By streamlining the data visualization design process through reusable components, we ensured that even the most complex charts and maps could be deployed consistently. It saves a company a great amount of time, costs, and resources.
Challenge 4. Data visualization and representation
This challenge involves presenting complex and large amounts of data in a clear and understandable way to the users.
Here’re a few approaches you can adopt when dealing with such a complex task:
- One common challenge is choosing the right level of detail in data representation. While detailed data can provide a more comprehensive understanding of the information, it can also overwhelm users, making the most important data difficult to interpret. On the other hand, oversimplifying data can lead to the loss of essential information.
For example, when we were designing a prototype for Tromzo, software that helps developers monitor the safety of their code, we created two versions of a dashboard for admins and developers because they needed different levels of data access.
The general dashboard shows the information important for developers without overwhelming them. It provides an overview of the chosen time period, including the number of newly discovered vulnerabilities, resolved issues, and so on.
.png)
In contrast, the admin's full-access dashboard offers a more comprehensive array of categorical data for managing risks, such as generating tickets, modifying assignments, resolving issues, and so on.
.png)
- Another approach to data representation is data visualization, which allows users to quickly interpret information by representing it in a graphical form. However, designing effective data visualizations requires careful consideration of the data's properties, the target audience, and the purpose of the visualization. This level of precision is especially critical in geospatial product design, where the spatial relationship between data points must be instantly intuitive.
Getting back to the Tromzo case study, we were able to simplify the navigation through code vulnerabilities with the help of proper data visualization. While the entire list of vulnerabilities is presented in a table, larger projects frequently have an extensive list of issues, which can make it challenging to locate specific items.
To address this issue, we implemented a heatmap containing a collection of tiles representing teams, projects, or repositories. Each tile is assigned a unique color based on the level of risk associated with it.
.png)
- Finally, data representation should be consistent throughout the application to avoid confusion and improve user experience. Consistency includes the use of the same terminologies, icons, and symbols across the application.
That’s the reason we often create UI kits for our clients. This approach saved us a lot of time and effort when iterating on Cylynyx’s MVP design, a no-code graph visualization platform.
.png)
Now, let’s summarize the most effective and universal approaches you can adopt when facing some of the above-mentioned issues.
Our best practices to design data-intensive applications
Data is a valuable resource in today's world, but to unlock its full potential and extract meaningful, deeper insights, it must be carefully presented and analyzed. For that reason:
- Don’t neglect UX research: it enables the design team to make informed decisions regarding the application's UI and UX. Conducting UX research involves various techniques such as surveys, user testing, usability testing, and user interviews, among others. These techniques provide valuable insights into how users interact with the application, which can guide the design process. The insights gained from UX research can be later used to develop personas, user journeys, and wireframes, which help ensure that the application is designed with the user in mind.
- Design for scalability: Data-intensive applications need to be designed with scalability in mind from the outset, as the amount of data they process is likely to increase over time. This means designing a flexible architecture that can easily scale up or down as needed. By creating UI kits, and building UX design systems will help to ensure your product will stay consistent when growing.
- Ensure data security and privacy: Data-intensive applications often deal with sensitive or confidential data, so security and privacy must be your top priority. Best practices for data security include encryption, access controls, and regular security audits.
- Use a consistent and intuitive design: Consistency is key when it comes to designing data-intensive applications. Users should be able to quickly understand and navigate the application without having to learn new interactions or controls. Stick to standard design patterns and use familiar UI elements to provide an intuitive user experience.
- Provide clear data visualization: Data visualization is a key part of data-intensive applications. Use charts (e.g., line charts, bar charts, or pie charts), graphs, and other visual aids to power users quickly understand data insights. Provide clear labels and annotations to keep the accessibility in UX and help users interpret the data.
- Offer customization options: Different users have different needs when it comes to data-intensive applications. Offer customization options that allow users to adjust the display and analysis of data to suit their needs. This can include filtering, sorting, and other customization options.
- Use responsive design: Data-intensive applications are often used on a variety of mobile devices and screen sizes. Use responsive design principles to ensure that the UI adapts to different screen sizes and devices. This can include adjusting the layout and size of UI components and providing a mobile-friendly design.
- Provide feedback and error handling: Data-intensive applications can involve complex calculations and data analysis. Provide clear feedback and error handling to help users understand when something goes wrong.
Key takeaways
In conclusion, we can say that the success of data-intensive applications heavily relies on user experience design. By prioritizing UX design from the outset, customers can avoid the costly and time-consuming process of redesigning later on. Bringing the UI/UX designer onboard early in the process establishes a solid foundation for future growth, making the system scalable, robust, efficient, and accessible.
Our team has extensive experience in designing data-heavy interfaces that not only handle complex data but also provide a seamless and intuitive user experience. We understand the importance of balancing aesthetics with functionality, and our designs reflect this philosophy. So if you're looking for a UI/UX design agency that can help you create data-intensive applications that your users will love, don't hesitate to contact us.